


Campus Climate Survey Results Unveiled
The University of Maryland, Baltimore (UMB) released results of its Gallup Climate Survey during President Jay A. Perman’s quarterly Q&A on June 19 in the School of Social Work auditorium.
The recommendation that UMB undertake a climate survey — assessing students’ and employees’ views on issues of diversity and inclusion on campus — first appeared in the University’s 2011–2016 Strategic Plan. A climate survey was broached again during UMB’s “Continuing Conversation About Race,” held in the aftermath of Freddie Gray’s arrest and death in spring 2015.
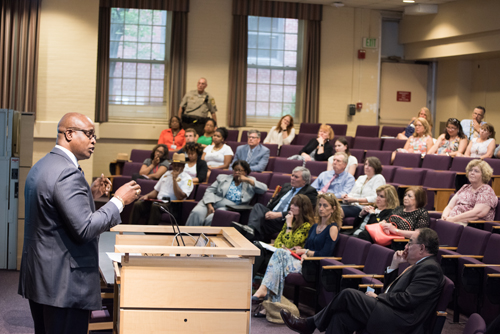
Chief Accountability Officer Roger Ward discloses the results of the University of Maryland, Baltimore's recent campus climate survey at President Jay A. Perman’s quarterly Q&A.
The survey is meant to assess the UMB community’s perceptions of campus climate and to establish a baseline for future surveys, so that University leadership can determine whether progress is being made over time and can tailor interventions to assure improvement.
While Gallup developed an inclusiveness index for UMB’s use, the University tailored the survey to its own needs and worked with Gallup to expand the number of indices on which to gather data. Below are the campus climate indices that were measured.
- Inclusiveness: Sample questions — My supervisor creates an environment that is trusting and open. I always trust my organization to be fair to all employees.
- Honoring Diversity: At UMB, staff and faculty appreciate others whose race/ethnicity is different from their own. UMB provides an environment for the free and open expression of ideas, opinions, and beliefs.
- Confidence in UMB: There is open communication throughout all levels of the organization. My organization encourages new ideas that defy conventional wisdom.
- Input on Decision-Making: The leadership at the University level provides adequate opportunity for faculty and staff to provide input on decision-making through the shared governance process.
- Organizational Values: I strongly believe in our organization’s values. I understand how the organization’s values impact how I do my job.
- Safety: I feel safe on UMB’s campus. I feel safe in my work environment.
The June 19 climate survey presentation focused only on faculty and staff respondents. However, students were surveyed as well, and the results of the student survey will be shared this fall with the University Student Government Association and other student leadership groups.
In all, nearly 2,700 employees responded to the survey, 42 percent of UMB’s total employees. About half of all white, black, and Hispanic employees participated in the survey, along with 29 percent of Asian employees and 43 percent of employees who identify by two or more races. More women participated than men — 50 to 39 percent — and the greatest response rates came from employees working at UMB between 10 and 40 years.
The survey was developed on a scale of 1 to 5, with 1 indicating that respondents are “extremely dissatisfied” and 5 indicating that they are “extremely satisfied.” Across all climate indicators and across all categories of employees — race/ethnicity, gender, and length of employment — virtually all responses fell between 3.0 and 4.0. (There were two outliers: Employees working at the University less than six months gave high marks to UMB’s commitment to diversity and organizational values; their average score on both indices was 4.15.)
Across all indices, there were differences in scores among the employee categories, but almost all of these differences were small. The one exception was found on the diversity index, where there was a moderate difference between genders, with men giving UMB higher scores than women.
Perman noted the relatively high scores on the organizational values index, where scores across all employee categories ranged from a low of 3.72 to a high of 4.15. “That encourages me; that’s a great place to start,” he said. “If people perceive the institution as not just sloganeering, but actually committed to its values, then that’s a good place to go forward.”
Roger J. Ward, EdD, JD, MPA, chief accountability officer and vice president of operations and planning at UMB, said that the results indicate a “pretty good baseline,” but that there’s clearly room for improvement. “In general, we performed above average,” he said, “but our goal is to get even better.”
Ward discussed next steps to do just that. He said the UMB leadership wants to understand the root causes of the differences in responses among employee categories and will use qualitative interviews and focus groups to gather more information. The University will create affinity groups — for instance, “women in leadership” or “junior faculty of color” — to allow groups of employees to connect and work together on advancing UMB’s diversity and inclusion goals. UMB will build diversity and inclusion priorities into recruitment processes and create programs to engage and develop diverse, inclusive leaders.
Added Ward: “We’ve committed to each of the deans to share their data with them so they can drill down to see how their own school performed. And that’s true for any administrative unit. We gathered the information so we can identify and expose areas perceived to be in need of improvement, and as important, learn from those areas that are perceived to be performing above the institutional averages.”
In three years, UMB will conduct a follow-up climate survey to assess progress. “This is a long-term effort,” said Perman. “That’s why it was so important to know where we are right now. Only then can we know where we want to be.”
